|
A technique for enhancing the assessment of the structural condition of a Blackbutt (Eucalyptus pilularis (Sm.) using the combination of IML Resi’ PD400, Sonic PiCUS Tomograph (PiT) and Electric Resistance Tomograph (ERT) instruments.
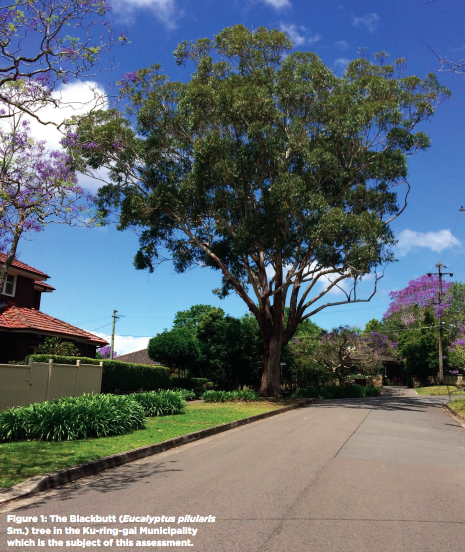
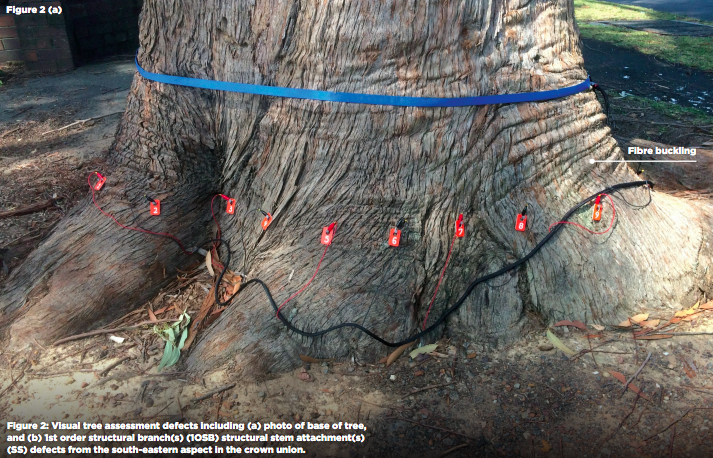
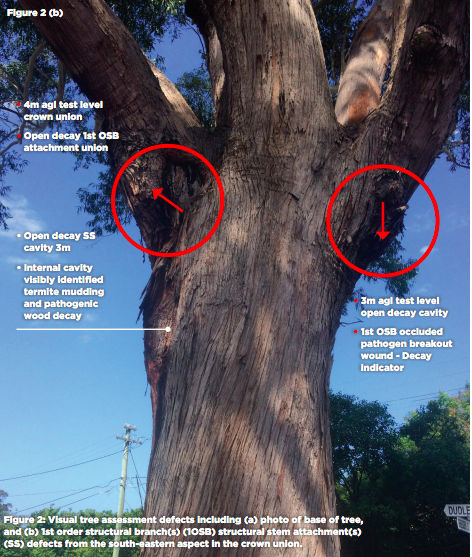
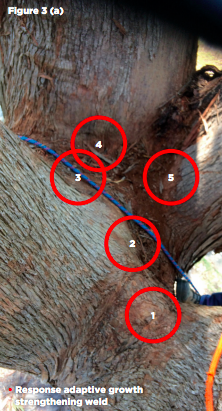
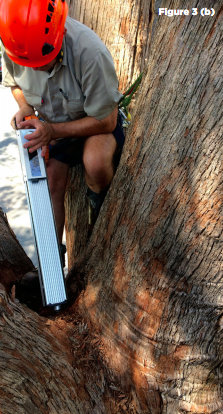
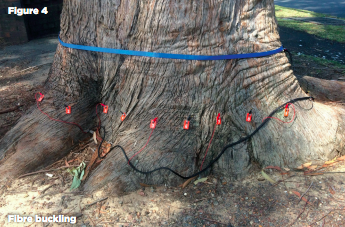
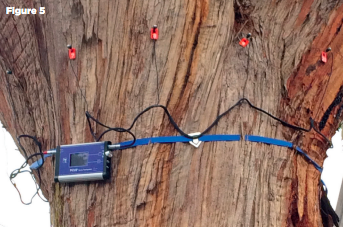
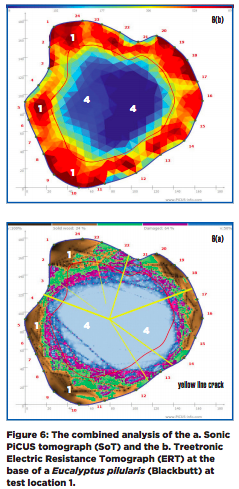
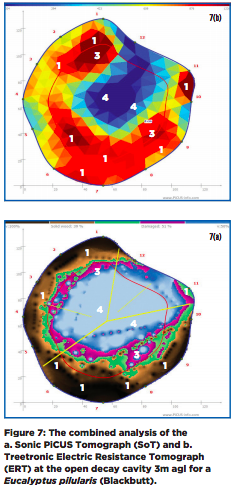
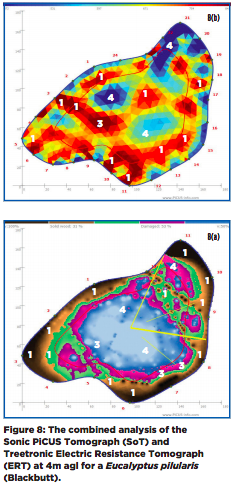
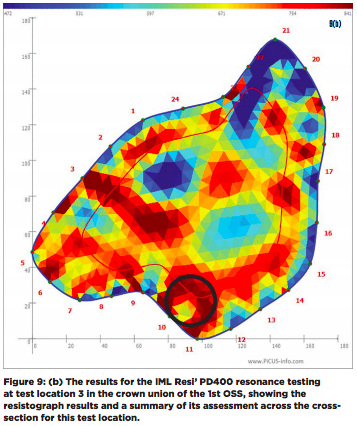
Abstract A recent health and structural assessment of a street tree in the Ku-ring-gai Municipal area used the combination of IML Resi’ PD400, PiCUS Sonic Tomograph (SoT) and Electric Resistance Tomograph (ERT) to assess the tree for decay and the risks associated with structural decline. The assessment concluded that the tree was of relative sound health and structure based on the combination of three techniques despite the tree showing indications of internal decay. The outcome would not have been the same if the assessment was limited to the PiCUS software (SoT) alone because the ERT identified the presence of adaptive growth which the Resi’ confirmed as sound wood at these locations. This technique shows promise for the assessment of older trees with decay and allows the better quantification of the internal decay based on a combination of factors so that tree risk assessments can be made on an individual tree and quantitative basis. Introduction The assessment of trees for their structural soundness is important to identify the risks associated with maintaining a potentially hazardous tree. In addition, trees of structural soundness in urban environments provide a range of other benefits i.e. habitat, aesthetics, carbon sequestration and recreation. The street tree in this report was identified by the Ku-ring-gai Municipal Council as a potential risk to the safety of pedestrians and motorists, with potential impacts to services, adjacent residences and recreational areas. The tree is approximately 18 m high with a diameter at breast height (@1.4m) of 121cm. The stage of the growth of the tree was considered as mature. The tree was dominant in the street setting and provides medium wildlife habitat value. On initial visual assessment the tree had a least one, open decay cavity at 3m above ground level (agl), in the northern stem quadrant. There were no visual signs of animal activity. The tree was relatively symmetrical in form with canopy loading in a northerly direction (Figure 1). The crown density was about 90 per cent compared to that for the genus and species when in good condition and of normal vigour. There were some abiotic impacts including a footpath and roadway to the east and western sides of the tree. There had also been some historical pruning resulting in the regrowth of epicormic into endocormic branching. Figure 2: Visual tree assessment defects including (a) photo of base of tree, and (b) 1st order structural branch(s) (1OSB) structural stem attachment(s) (SS) defects from the south-eastern aspect in the crown union. Methods The tree health and structure was assessed using a Tree Risk Assessment methodology as outlined by the International Society of Arboriculture (ISA) Best Management Practices for Risk Assessment 2011. This included a visual tree assessment (VTA) to identify tree characteristics and potential hazards at the ground, in the stem and in the upper canopy. The basic level 2 assessment identified the presence of an extensive columnar, basal decay interconnecting with an open decay cavity at 3m above the ground (agl) and at the crown union. Pathogenic wood decay from fungal colonisation was suspected however no fruiting bodies were evident. The presence of this external decay escalated the inspection to an advanced ‘level 3’ which required further investigation of the decay. The advanced Level 3 assessment used PiCUS 3 Sonic Tomograph (SoT) and PiCUS TreeTronic Electric Resistance Tomograph (ERT) (Argus Electronic GmbH, Rostock, Germany) to assess the presence and location of decay in the tree stem as well as the size, shape and characteristics in terms of mechanical properties of the area of interest (Wang and Allison, 2008). While both these techniques are non-invasive the combination of the SoT and ERT methods can help overcome the limitations of either technique being used in isolation and can provide a better conclusion about the trees structural condition. The SoT and ERT assessments were carried out at the buttress (figure 2a), at the open decay cavity at 3m above ground level (agl) and at the crown union, 4m agl (figure 2b). The IML Resi’ PD400 (IML Instrumenta, Mechanik Labor Systems, GmbH, Wiesloch, Germany) was only used at the crown union (at 4m agl) (Figure 3a). While the first two tools identify the location and extent of decay, the IML Resi’ PD400 resistograph tool confirms the presence of response adaptive growth by comparing the resistance (density) of adaptive growth and stem thickening at these locations against a sample of resistance (density) from solid wood in the same tree. Response adaptive growth is interpreted as the tree’s response to structural weakness, decay, stem movement and increase in wood growth thickening (additional layers of wood) or joining (welding) at branch unions. All measures were taken in January 2018. PiCUS Sonic Tomographs (SoT) The SoT method measures internal decay using sound waves with the principle being that sound waves travel slower through decay when compared to solid wood (Gilbert and Smiley, 2004). This is done using a series of sonic sensors (receivers) which are placed around the stem using a series of small pins to record the signals. The pins are tapped manually with an electronic hammer and the velocity of the sound waves and geometry of the sound waves are recorded as a tomogram (graph). The tomogram shows the relative and apparent ability of the wood to transmit acoustic waves while the different colours in the tomograph correlate to mechanical wood quality (modulus of elasticity), a measure consistent with the mechanical structure of the wood at the cross-section of the stem where it is measured. PiCUS Treetronic Electric Resistance Tomograph (ERT) The ERT on the other hand uses a low electric voltage to examine the tree and provide a high-resolution electrical conductivity map of the tree’s crosssection (Goncz et. al., 2017). The electric resistance of the wood is influenced by the water content and changes within the wood structure. The resulting tomograms are coded with a blue, green, yellow and red colour range showing blue as areas of low resistance and high-water content (potential decay), through to red showing high resistance and low water content. ERT tomograms are specific to individual tree species as each tree has its own typical electrical resistance distribution. The combination of electrical and sonic tomography in the PiCUS Treetonic system provide a detailed survey allowing more accurate differentiation of various internal defects (Brazee et al., 2011). Both the SoT and the ERT assessments were carried out at the buttress (Figure 4), at 3m above ground level (agl) and crown union 4m agl (Figure 5). IML Resi’ PD400 In addition to these two methods, resistance testing using an IML Resi’ PD 400 was also used at five positions, at the attachment points of the 1st order structural stems within the crown union. The location of the IML Resi’ PD400 tests are shown in Figure 3a and 3b where each drill location provides a cross-section of the resistance of the wood against the drill bit. The IML Resi’ PD400 instrument assesses resistance to the drill bit of the instrument through the wood and this is then displayed as a graph. The path of the drill bit was selected from cross-sections of the crown union using the SoT and ERT tomographs. Each resistance drill test was compared to a sound wood comparison drill test identified upon the subject tree. This allows a correlation to be made with sound wood and to better identify weakened decaying wood or response adaptive growth. Where there is higher resistance compared to the sound wood, this indicates wood of a higher amplitude (low moisture content – red in colour on ERT tomograph when integrated with SoT tomograph) and where there is lower resistance this indicates incipient early decay, compromised or decayed wood (higher moisture content - blue in colour on the ERT tomograph when integrated with SoT tomograph). This measure of internal wood resistance is used as an index of wood density at different positions and can be used within the crown union in areas subject to response adaptive growth, to confirm a sound structure. Strength retention formula In addition to these measures, the t/R ratio is described as the thickness of sound wood in the residual wall(s) of the section of the stem being measured. In this case we compare the ratio of the thickness of the wood of the stem or branch tested, at each location; to the radius of the trunk or branch. 30-35 per cent is the minimum threshold for a tree part (trunk or branch) wall section, to be considered of sound integrity (Mattheck and Breloer, 1994)(see internal red line in figures 6a, 7a and 8a). Limitations of the t/R formula The conventional t/R ratio test is based on field studies of vertical, cylindrical trunks with the decay centrally located and uniform. When the stem is leaning, asymmetrical in shape, or the decay is off centre, the guidelines for shell wall thickness should be used very cautiously. The greater the disparity in shape, away from a cylinder or decay off centre, the greater the inaccuracy. The t/R was used as a guide only in the assessment to assist in the trees risk rating determination. Additional data such as location of decay, presence of response growth, direction of loadings, size and age of tree, wind exposure, etc. are also considered to complement the t/R results and to determine a more accurate likelihood of failure and final recommendation. Results and discussion - PiCUS Sonic tomograph (SoT) and Treetronic Electric Resistance Tomograph (ERT) At the first location (base of tree), the cross-section of the wood shows approximately 24 per cent of wood was solid on the circumference of the tree stem with some relatively symmetrical, internal columnar decay, representing 76 per cent of the trunk comprised of decay and incipient wood. The results of the SoT and ERT tomograph at location 1 (the tree base) are shown in figure 6. Table 1 gives the key to interpreting figures 6, 7 and 8. The numbers in figure 6 represent the status of the wood according to the SoT and ERT tomograph key (Table 1). The second test location tomograph’s (Figure 7), show an open decay cavity at 3m displayed, presenting as an asymmetrical open internal, columnar decay. The cross-section of the wood Figure 6: The combined analysis of the a. Sonic PiCUS tomograph (SoT) and the b. Treetronic Electric Resistance Tomograph (ERT) at the base of a Eucalyptus pilularis (Blackbutt) at test location 1. Figure 7: The combined analysis of the a. Sonic PiCUS Tomograph (SoT) and b. Treetronic Electric Resistance Tomograph (ERT) at the open decay cavity 3m agl for a Eucalyptus pilularis (Blackbutt). shows 39 per cent of solid wood on the circumference of the tree stem with some asymmetrical internal columnar decay represented by 51 per cent of decay and 10 per cent incipient or altered wood. The results of the SoT and ERT tomograph at test location 2 are shown in figure 7a and b. The numbers in figure 7a and b represent the status of the wood according to the SoT and ERT tomograph key (Table 1). The third location showed an internal decay cavity at the crown union at 4m agl. The cross-section of the wood shows 31 per cent of solid wood with 53 per cent of decay and 16 per cent incipient or altered wood. The IML PD400 resi’ tests at this location identified small pockets of response adaptive growth, as shown by the red areas (high ERT resistivity) in the ERT diagram in figure 8b. The results of the SoT and ERT tomograph at test location 3, at the crown union 1st OSS are shown in figure 8. The numbers in figure 8a and b represent the status of the wood according to the SoT and ERT tomograph key (Table 1). IML Resi’ PD400 The IML Resi’ PD400 test locations were identified with reference to the ERT and SoT measuring points (mp) as areas of high ERT resistance. At the 1st OSS attachment union each of the five IML Resi’ PD400 results showed wood with good resistance and adaptive growth welds which contribute to stem strengthening at this location (Figure 9). Figure 9 shows an example of one, of the five, IML Resi’ PD400 resistograph test locations. The IML Resi’ PD400 resonance testing is shown for location 3 (adjacent to ERT mp 12) in the crown union of the 1st OSS. The resulting resistograph identifies generally good resistance (compared to solid wood), potentially indicating response growth (due to branch welds or strengthening wood), with a small pocket of compromised wood at 16-17 cm. The assessment table under the resistograph summarises the resistance measure in cm from the start through to the end of the drill cross-section. The final decision The determination to retain this tree was based on a combination of the following decision making steps: 1. An analysis of the quality of wood at each defective tree part (Basal SS, open decay cavity 3m agl and crown union SS 4m agl) 2. The risk rating of each defective tree part and whether each reached the failure criteria where t/R was decided upon with evaluation and consideration of: • PiT (Volume and location of decay and residual wall thickness and location); • ERT (Volume and location of response growth versus decay and location); • Confirmation of response growth thickening within the crown union with use IML Resi’ PD400; • The subject trees visual body language; • The loading on the defective tree parts; and • The target trees likelihood of failure, and the impact and consequences of failure Conclusion The three scientific decay analysis tools used in this discussion paper included the IML Resi’ PD400, Sonic PiCUS Tomograph (SoT) and the Electric Resistance Tomograph (ERT). Using these results in combination with the other important risk considerations provides a new and insightful basis for determining the soundness of large landscape trees. This is particularly useful where visual assessment alone may ordinarily prove difficult to provide enough information for retention as opposed to removal. In addition, with the PiCUS assessment tool alone the tree would have been likely condemned by most PiCUS operators (Arborists) due to the presence of decay. However, with the introduction of ERT tool used in conjunction with SoT, showed that the strength of the timber in the residual walls of this tree were determined to be of sufficient strength for its size and the amount decay present, and hence the tree was recommended for retention. The use of IML Resi PD400 in association with ERT has confirmed sufficient response adaptive growth in the crown union which identifies areas of high resistance reducing the risk of stem failure and the potential for public risk. References Bieker, D., Kehr, R., Weber, G., Rust, S. (2010) Non-destructive monitoring of early stages of white rot by Trametes versicolor in Fraxinus excelsior. Ann. For. Sci. 67(2):210. Gilbert, E., Smiley, E.T. (2004) PiCUS sonic tomography for the quantification of decay in white oak (Quercus Alba) and Hickory (Carya spp.) J. Arb. 30(5): 277-281. Goncz, B., Divos, F., Bejo, L. (2016) Detecting the presence of red heart in beech (Fagus Sylvatica) using electrical voltage and resistance measurements. Eur, J. Wood Prod. DOI 10.1007/s00107-017-1225-4. Mattheck, C., Breloer, H. (1994) Field guide for visual tree assessment (VTA) 18(1): 1-23. Nicolotti, G., Socco, L.V., Martinis, R., Godio, A., Sambuelli, L. (2003) Application and comparison of three tomographic techniques for detection of decay in trees. J. Arb. 29(2): 66-78. Wang, X., Allison, R.B. (2008) Decay detection in red oak trees using a combination of visual inspection, acoustic testing and resistance microdrilling. Arb & Urban For. 34(1):1-4. |
About Us
Graham Brooks Arboricultural Tree Services Pty Ltd - a highly skilled arborist with more than 38 years of industry experience.
He is a Professional Member of International Society of Arboriculture (ISA) and a Certified Consultant with Arboriculture Australia.
Graham is insured with public liability to $20m and professional indemnity to $5m.
ABN 57093391407 - ACN 093391407
CALL US NOW ON 0412 281 580
