1. Introduction
This tree risk assessment has been requested by Ku-ring-gai Council (KMC) who has requested my professional opinion on the condition, health and structural integrity of one Eucalyptus pilularis (subject tree) located and growing within the Council nature strip adjacent to the northern property boundary in St. Ives, NSW 2075. This analysis was conducted using Picus Sonic Tomography (SoT) and Electric resistance tomography (ERT).
2. Scope
This report is only concerned with; Assessing the health and structural condition of 1 x Eucalyptus pilularis tree.
The structural impact and assessment from the subject tree upon any fixed property structure has not been undertaken as this is beyond the field of my expertise. Clearly visual structural damage was photographed, noted and detailed within this report.
This report follows the guidelines within the Ku-ring-gai-Council - Development Control Plan, Local Environmental Plan (KLEP) 2015.
3. Discussion
The following narrative serves as a brief discussion on tree risk assessments to inform on some of the considerations required within the context of this assessment.
Concepts of Tree Risk
3.1. Health versus Structure
A brief discussion on tree health and structure is warranted here. The individual components of a tree provide unique and integrated support to maintain a tree’s system. Each component’s structure and functions are complex in nature. Three roles of wood as one of these components is to provide a transportation system for water and nutrients throughout the tree, storage of starches for later use and a support system for the whole tree.
Sapwood, the outer circle of annual rings, is comprised of living tissue and primarily provides the transportation system and support. Heartwood, the interior annual rings of the tree, is comprised of dead tissue and provides the main support system for the tree.
As decay deteriorates the interior of the tree, its structural integrity is compromised. At the same time, the sapwood may still be fully functioning providing water and nutrients to the system. In essence, a tree can appear healthy yet be structurally unsound.
3.2. Defects Associated with the Trees
There are three issues of significance associated with the two trees in question.
a) Decay – Process of degradation of wood by microorganisms and fungus. (Australian Standard 2007, p. 6) Decay, in the context of a tree, is a deterioration of wood fibre caused by decay organisms. The decay process is realized in stages, from early discoloration to cellular breakdown and eventual formation of a cavity.
A tree can exhibit all stages at the same time. Types of decay can be separated into those that undermine the cellulose, which reduces bending strength, or undermines the lignin, which reduces compressive strength. Any form of decay reduces a trees structural integrity. The presence of decay does not necessarily mean a tree has a high risk of failure. The extent of decay and additional contributing defects greatly affect risk determination.
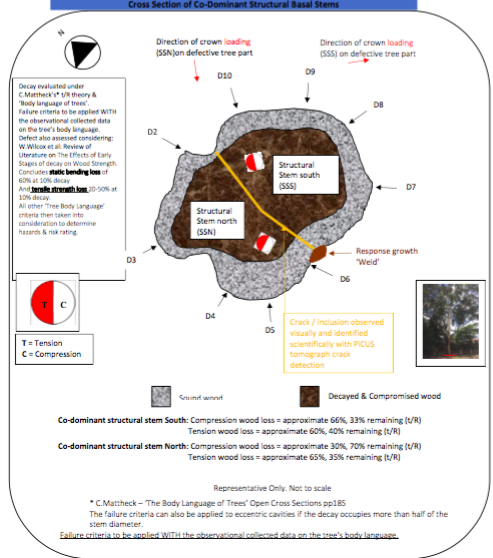
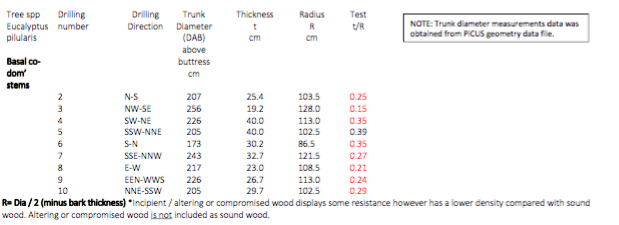
b) Strength Retention Formula – The arboricultural profession has relied on a number of strength retention formulas to assist in determining the risk associated with decay. The most common formula in use was devised by Klaus Mattheck ‘The Body Language of Trees’ (Mattheck and Breloer, 1994) and is presented as t/r, where t is the thickness of sound wood and r is the radius of the part being measured. Commonly, a figure of 30 to 35 percent for full crown trees is considered a threshold for raising concerns about the integrity of the tree. Numbers below this threshold are an indicator of increasing risk.
These types of formulas have allowed the profession to better understand that decay can be present to a limited extent and structural integrity may be minimally compromised. They have also informed our understanding that a tree that can maintain a healthy cylinder of solid wood, without exceeding strength limits, could also be structurally stable. Complicating factors that certainly compromise this system are associated with the range of mechanical differences between species, irregular decay patterns and additional defects. Any strength loss formulas within this report are used as a guide only.
Note: Many trees have variable canopy and trunk loadings and are often not symmetrical and not ‘Centralised’. Tree’s often produce reaction strengthening wood to compensate for a weakness within its structure. All variable biotic and abiotic conditions have been taken into account in determining the likelihood of failure and Risk Rating as detailed within this report.
C) The most common forms of structural tree defects are:-
Wounds to the trunk and branches; Damage to roots or disturbance of soil; Decay within trunks, branches or roots; Cracks, splits and bulges;
Excessive leans or branch end-weight.
Weak branch attachments and included bark (where the bark of two stems is caught between growing stems forming an inherently weak attachment); Deadwood and hanging branches.
Cracks and Stress - Trees experience two forms of loading. Static loading is constant and is typically conveyed as the stress experienced by a tree from gravity. In other words, the tree must counter the effects of supporting itself while standing. External loading, such as wind, snow, etc. fluctuate over time and effect different parts of the tree at different times and intensities. Trees are adaptive structures that react to both stresses over time by developing reaction wood and adding girth.
Cracks are forms of structural failure. They occur when demands on the tree from stresses exceed the capacity to withstand the loading. Cracks are one of the key factors that compromise efforts by the tree to counter the effects of stresses. Trees require time, measured in years and decades, to react to both static and external stresses. Cracks disrupt this function by compromising the trees ability to respond quickly.
3.3. Assignment of Risk
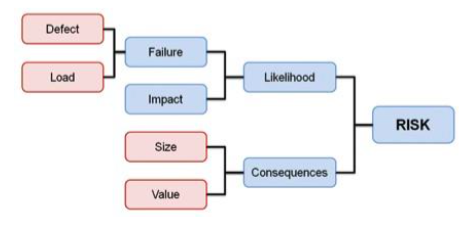
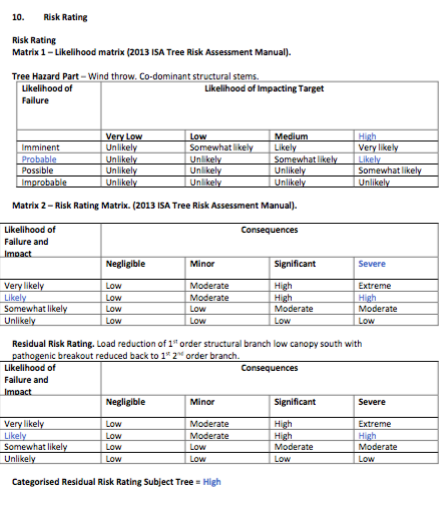
Current concepts of risk centre on determining the likelihood of a tree part to fail (hazard) and the likelihood of the part then striking a target (risk). The likelihood of failure is determined by numerous variables and can include species, defects, reaction wood, environmental factors, loading, etc. The likelihood of striking a target is mainly determined by occupancy rates, direction of failure and protection factors. The final element of a tree risk assessment is determining consequences. Matrix 1, called the “Likelihood Matrix” provides a likelihood outcome (unlikely to very likely) based on combining the potential of a tree part failing and the potential of that same part then impacting a target.
Matrix 1 – Likelihood matrix (2013 ISA Tree Risk Assessment Manual).
Matrix 2, called the “Risk Matrix” provides a risk outcome (low to extreme) based on combining the results from the likelihood matrix and the consequences if the likelihood of the event were to occur.
Matrix 2 – Risk rating matrix (2013 ISA Tree Risk Assessment Manual).
Flow Chart indicating categories used to determine risk.
4. Methodology
4.1 The method for Tree Risk Assessment used in this report is that which is outlined by the International Society of Arboriculture (ISA) in their Best Management Practices – Tree Risk Assessment 2011. This is a companion publication to the American Standard ANSI A300 Part 9: Tree, Shrub and Other Woody Plant Material management – Standard Practices (Tree Risk Assessment a. Tree Structure Assessment).
This method uses a matrix based, qualitative approach to risk assessment.
The assessment of the subject tree was based on a “Level 2” tree assessment;
Escalated to an advanced “level 3” scientific decay analysis assessment of the subject tree.
A “level 2” assessment involves:-
A detailed visual inspection of the tree and its surrounding site and a synthesis of the information collected. The tree risk assessor walked completely around the tree looking at the buttress roots, trunk and branches.
Review of the trees condition using tools, where necessary, such as binoculars, hand lenses, a nylon sounding mallet, probes and a small shovel or trowel to expose root collars.
A review of the target area and the components of the tree most likely to fail.
Tools used include Picus Sonic Tomography (SoT) and Electric resistance tomography (ERT).
4.2 Assessment of whether a “Level 3” or “advanced” assessment is warranted which may entail aerial, internal decay investigative techniques or tree root inspections would be based upon external visual inspection.
Recommendation of level 3 scientific decay investigation would be based upon visual inspection, probing of cavity and acoustic invariants produced from hitting parts of trunk / stem with sounding mallet upon sound and decayed wood / hollow.
Recommendation of a level 3 aerial inspection would be based upon a visual structural fault / decay cavity / poor attachment point visibly located up in the tree canopy but out of reach for inspection from groundlevel. Canopy areas with decay wounds, cavities or displaying pathogenic activity may also require scientific decay investigation.
Recommendation of a tree root inspection would be based upon visual condition of the tree root plate / exposed lateral tree roots at ground level.
The risk rating guides the arborist in determining the action to be taken and in prioritizing the pruning or removal of high risk trees.
In the assessment and determination of trunk or stem failure of the subject tree the Mattheck formula for strength loss has been used.
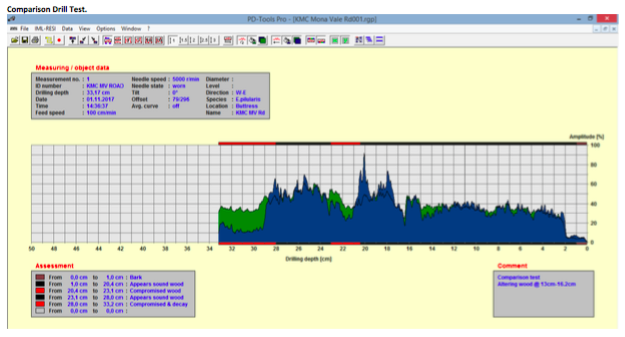
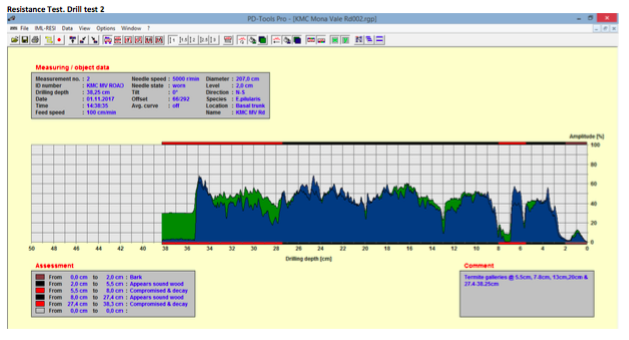
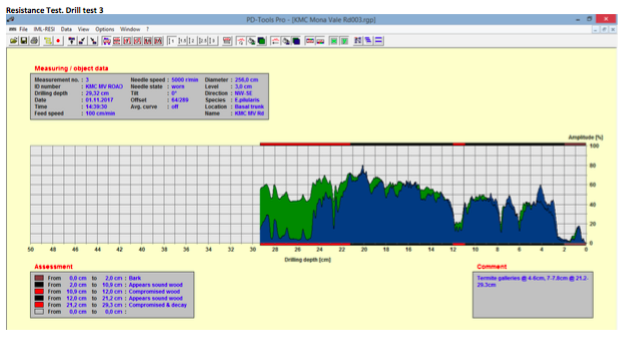
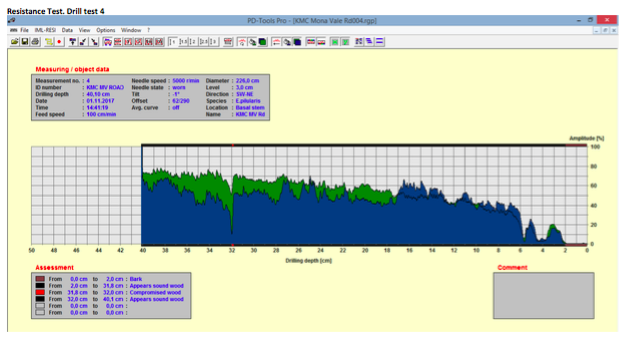
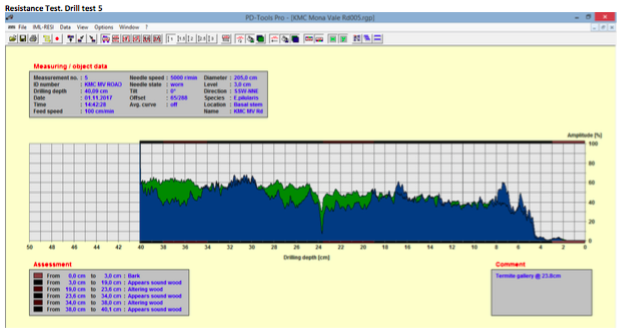
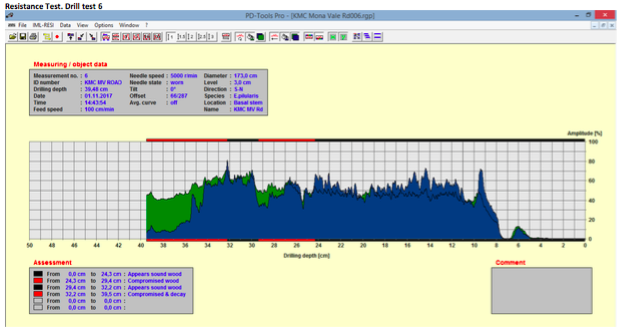
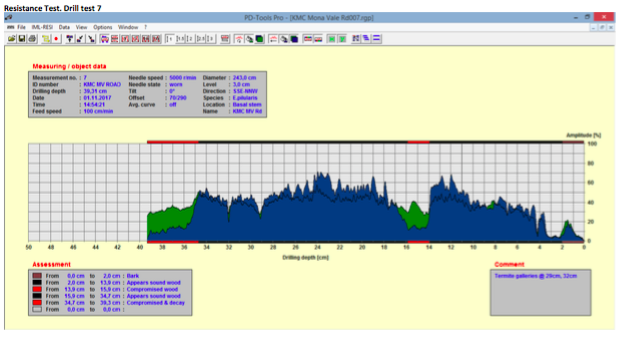
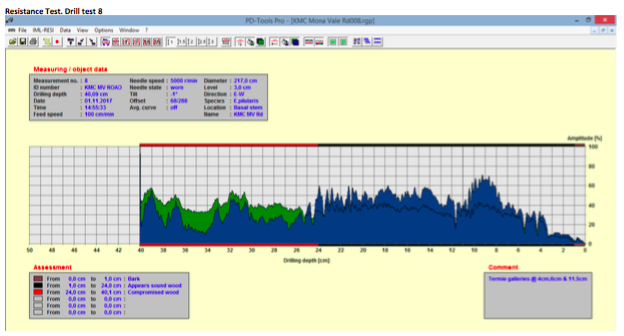
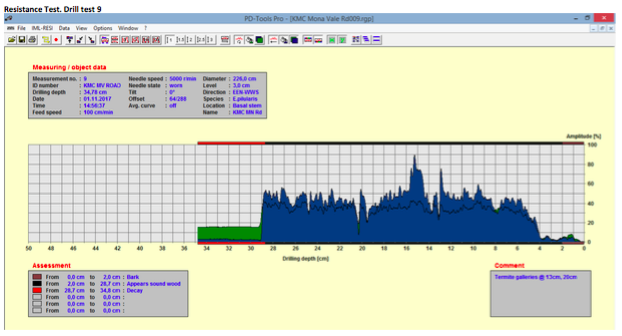
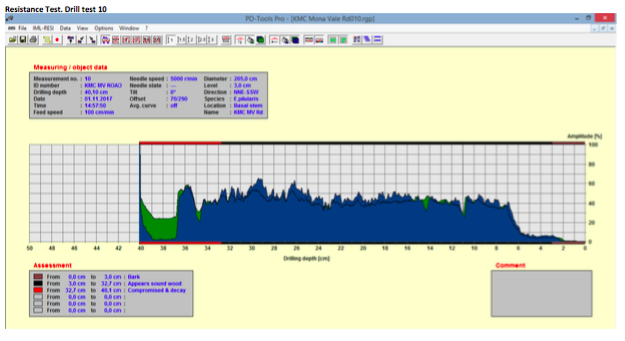
Diagnostic resistance tests were conducted using an IML Resi PD500 tool1 upon the subject tree’s basal co-dominant structural stem.
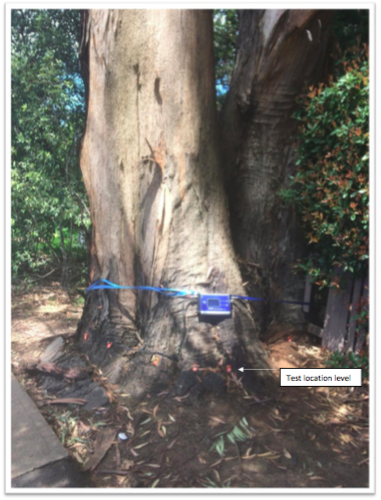
A Picus Sonic Tomograph (PIT) and Picus Tree Tronic Electric Resistance Tomograph (ERT) tests was undertaken upon the structural trunk stem at ground level.
4.3 Landscape Significance & Retention Value
The methodology used in determining the subject tree’s landscape significance has been assessed using;
Significance of a Tree, Assessment Rating System* (IACA 2010) – S.T.A.R.S. ©
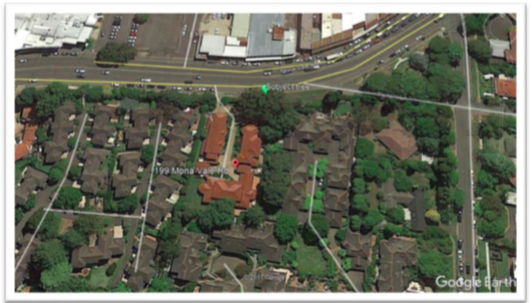
Site aerial view and subject tree.
5. Data Collection
Visual tree assessment (VTA)4, and decay analysis conducted from; (i) At ground level.
Other specific tree date was recorded in a notebook, PD500 decay diagnostic resistograph machine, Picus Sonic Tomograph (PIT) and Electric Resistance Tomograph (ERT) test machines and photographs taken using a digital camera.
6. Documents Provided.
• Email. Work Order. Date. 3rd October 2017. Comment. ‘Inspect, undertake tomograph testing near base and provide report/recommendations on large eucalypt.’
1 Diagnostic resistance test – An invasive method of measuring internal decay within timber to determine structural integrity.
2 Picus Sonic Tomograph test. A non-invasive method of measuring internal decay within timber with use of sound waves. 3 Electric Resistance Tomograph test. A non-invasive method of measuring wood properties within timber with use of electric current.
4 VTA: Visual Tree Assessment. A systematic methodology identifying tree characteristics and hazard potential. Recognised by International Society of Arboriculture.
7. Site Visits
Site Visits: 01/11/2017(1), 02/11/2017(2))
Time: 10am-4pm (1), 11am-12 noon (2),
Weather condition: Fine
Present: Mr. Graham Brooks. Consulting & Practicing Arborist. Arborist Assistant (1). Analysis Conducted: Visual tree assessment (VTA). Level 2 basic tree risk assessment. Escalated to advanced level 3 decay diagnostic resistance tests were conducted using a, Picus Sonic Tomograph and Electric Resistance Tomograph tests, Resistograph PD500 upon the subject tree’s root crown (1), Resistograph PD500 upon the subject tree’s co-dominant weld 1m agl (2), Collection of data.
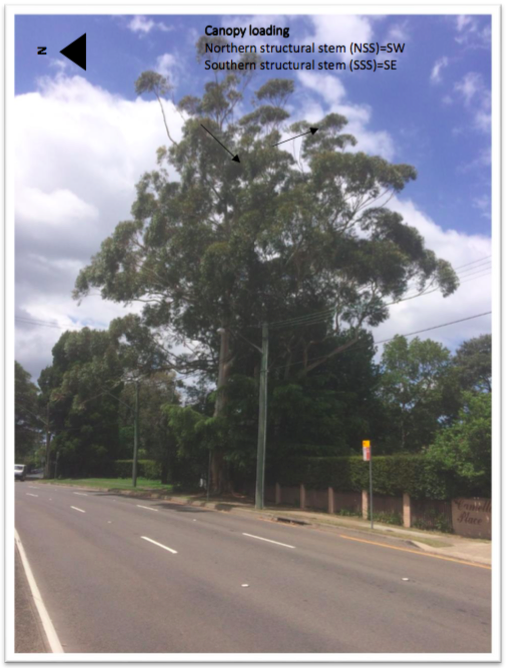
8. Condition & Assessment of the subject tree. Photograph 1. Subject tree. Eastern aspect.
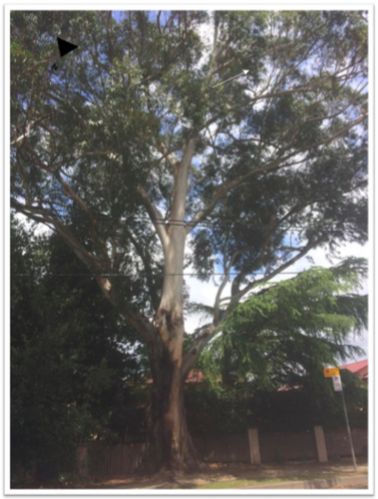
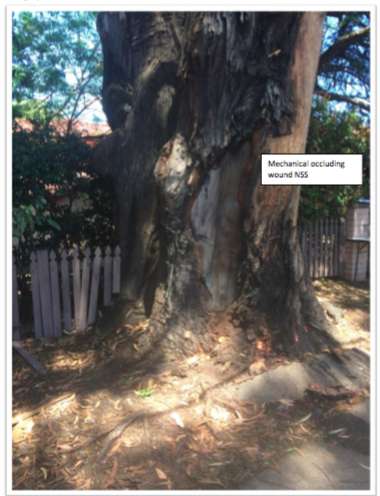
Photograph 2. Northern co-dominant structural stem loading SW. Southern aspect.
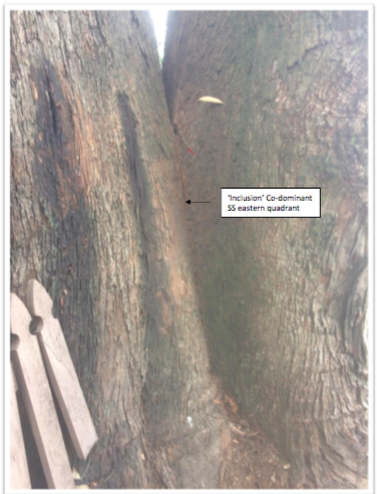
Photograph 3. Visual defects. South western aspect.
Photograph 4. Visual defect. Southern aspect.
Photograph 5. Visual defect. Western aspect.
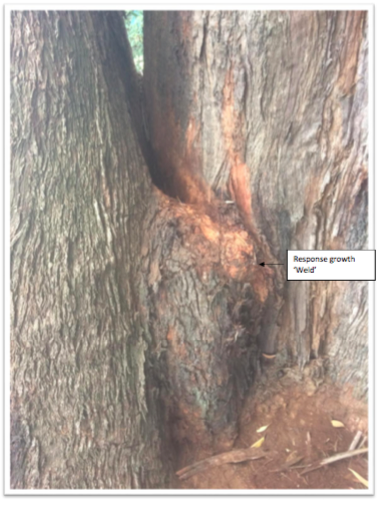
Photograph 6. Co-dominant structural stems. Response adaptive growth. Eastern aspect.
Photograph 7. Visual defect. Western aspect.
Photograph 8. Test location. Sonic PiCUS and sonic electric resistance tomography. Eastern aspect.
At the time of assessment it was evident:
The subject tree grew dominantly within the urban setting.
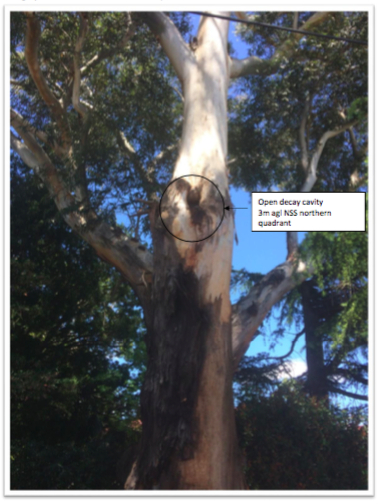
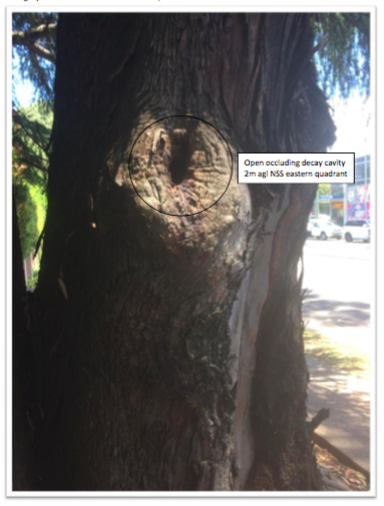
The subject tree was considered to provide medium wildlife habitat value. Two open decay cavities were visible 3m agl and 1m agl northern structural stem; however no visual animal activity was evident. (Animal classes)
The subject tree was found to be relatively symmetrical in form.
The canopy comprised of; Two co-dominant structural stems – each displaying moderate leans, the NSS with partially self-corrected response upper canopy growth.
The canopy loading; Co-dominant northern structural stem was in a south westerly direction and the southern structural stem was in a south easterly direction.
The crown density was considered to be at 70% compared to that idealized for the genus and species when in good condition and of normal vigor.
Evident
tree protection zone (TPZ). Past Historical Pruning Comprising off;
Resonance soundings of the basal trunk indicated internal columnar decay. Response growth development upon the subject tree;
The target areas included; Arterial roadway, electrical cables, residential/commercial property, recreational areas, & pedestrian footpath. No other botanical abnormalities were visually evident.
The subject tree grew dominantly within the urban setting.
The subject tree was considered to provide medium wildlife habitat value. Two open decay cavities were visible 3m agl and 1m agl northern structural stem; however no visual animal activity was evident. (Animal classes)
The subject tree was found to be relatively symmetrical in form.
The canopy comprised of; Two co-dominant structural stems – each displaying moderate leans, the NSS with partially self-corrected response upper canopy growth.
The canopy loading; Co-dominant northern structural stem was in a south westerly direction and the southern structural stem was in a south easterly direction.
The crown density was considered to be at 70% compared to that idealized for the genus and species when in good condition and of normal vigor.
Evident
- Active termites basal trunk.
- Open decay cavity 3m agl co-dominant NSS. Northern quadrant.
- Open decay cavity 1m agl co-dominant SSS. Eastern quadrant.
- Mechanical wound. 0.5m-2m agl co-dominant NSW. Northern quadrant.
- Large sized deadwood 10% canopy volume.
Abiotic Impacts;
tree protection zone (TPZ). Past Historical Pruning Comprising off;
- Removal of 1st OSB NSS low canopy Eastern quadrant. (Pedestrian footpath clearance)
- 1st Order Structural Branch (OSB) mid canopy northern quadrant. (Electrical cable clearance)
- 2nd 3rd and 4th OB NSS mid canopy. (Electrical cable clearance) Recent Pruning Comprising off;
Resonance soundings of the basal trunk indicated internal columnar decay. Response growth development upon the subject tree;
- Wound wood - Occlusion of pruning wounds was considered fair.
- Adaptive wood – strengthening co-dominant ‘weld’, ‘Ribs’ and buttress roots etc.
was considered good.
Diagnostic resistance tests were undertaken into the basal co-dominant stem. The internal structural condition of the tree part tested were;
The target areas included; Arterial roadway, electrical cables, residential/commercial property, recreational areas, & pedestrian footpath. No other botanical abnormalities were visually evident.
t/R limitations
The conventional t/R ratio test as devised by C. Mattheck is based on field studies of vertical, cylindrical trunks with the decay centrally located and uniform. When the stem is leaning, asymmetrical in shape or the decay is off centre, these guidelines for shell wall thickness should be used very cautiously; the greater this disparity in shape (away from a cylinder or decay off centre), the greater this inaccuracy.
The t/R was used as a guide only in this report to assist in the trees risk category determination. Additional data such as location of decay, response growth, direction of loadings, size & age of tree, wind exposure, etc. is more importantly considered to complement the t/R results to determine a more accurate likelihood of failure and recommendation.
Strength Retention Formula – The arboricultural profession has relied on a number of
strength retention formulas to assist in determining the risk associated with decay. The most common formula in use was devised by Klaus Mattheck ‘The Body Language of Trees’ (Mattheck and Breloer, 1994) and is presented as t/r, where t is the thickness of sound wood and r is the radius of the part being measured. Commonly, a figure of 30 to 35 percent for full crown trees is considered a threshold for raising concerns about the integrity of the tree. Numbers below this threshold are an indicator of increasing risk.
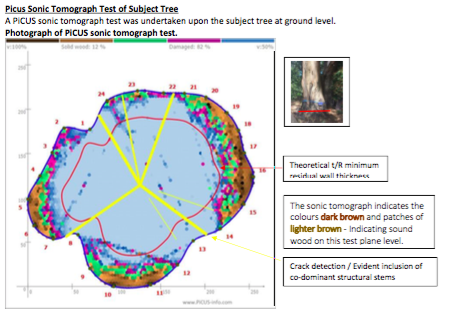
The PiCUS Tomograph measures the velocity of sound waves in wood in order to detect decay and cavities in standing trees non-invasively. The acoustic velocity depends on the modulus of elasticity and the density of the wood itself. Most damage and disease causes fractures, cavities, or rot and reduces the wood’s elasticity and density. The sketch displays the basic working principle, in that sound waves cannot take a direct path through the wood (red dotted line) if there is a cavity between the transmitter and receiver.
The acoustic waves are created manually with a little hammer, sonic sensors (receivers) record the signals. Little pins are used for coupling the sensors to the wood. Number and positions of the test points are critical to the accuracy of the scan.
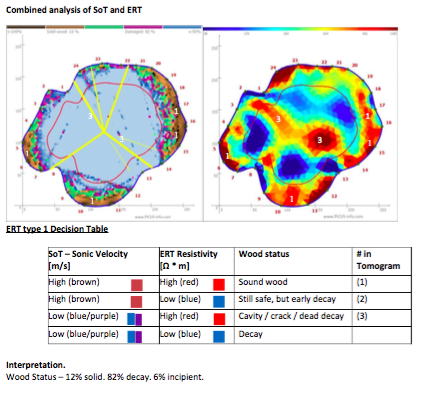
By using both acoustic travel-time information and geometry data of the measuring level the software calculates tomograms that show the apparent sonic velocities, the so called sonic tomograms acoustic tomograms. The speed of sound in wood correlates with wood quality and is therefore a measure for the breaking safety of the trunk. The PiCUS sonic tomogram shows the residual wall thickness.
To display different acoustic conductivity of wood, the PiCUS program uses set colours, assigning one colour to each point of the tomograph. Areas of high velocity are represented in black or dark brown. (Sound wood)
Areas of low velocity appear in violet, or blue, and these are the areas that indicate problems. Those colours do not mean that there is a cavity, it just mean that the acoustic waves travel slowest in that area.
Green areas mark those sections which could not be classified as being either fast or slow, and these areas must be interpreted together with the overall damage. The colour scale (black, brown, green, violet, blue) ranges from 100% velocity (brown) to the slowest velocity (blue).
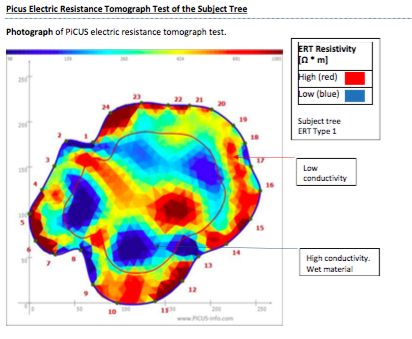
Picus Electric Resistance Tomograph test images of the subject tree below.
11. Recommendations.
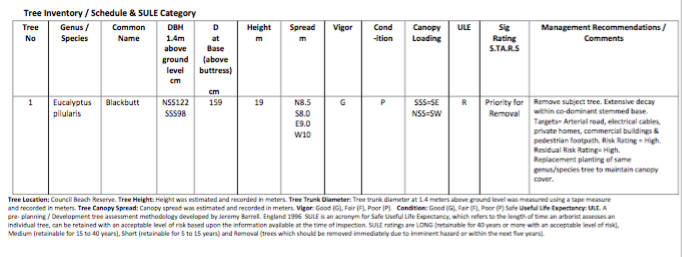
The subject tree has been categorised under the IACA Tree Retention Value (S.T.A.R.S) as ‘Priority for Removal’.
The categorised residual risk rating was High.
I recommend the following arboricultural management;
For more information on this technical feature, please contact Graham Brooks.
The subject tree has been categorised under the IACA Tree Retention Value (S.T.A.R.S) as ‘Priority for Removal’.
The categorised residual risk rating was High.
I recommend the following arboricultural management;
- Removal of hazardous tree.
- Replacement planting of same Genus/species tree to maintain canopy cover and bio- diversity.
For more information on this technical feature, please contact Graham Brooks.
About Us
Graham Brooks Arboricultural Tree Services Pty Ltd - a highly skilled arborist with more than 38 years of industry experience.
He is a Professional Member of International Society of Arboriculture (ISA) and a Certified Consultant with Arboriculture Australia.
Graham is insured with public liability to $20m and professional indemnity to $5m.
ABN 57093391407 - ACN 093391407
CALL US NOW ON 0412 281 580


